How is the Local Real Estate Market?
In today’s blog post we want to provide some real-time market stats to quantify the impact the COVID-19 Pandemic is having on the local real estate market. Please note, the data we track and present below is for the four-county area that we primarily service (DuPage, Will, Kendall, and Kane).
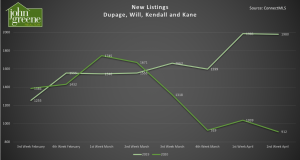
New Listings
In the graph below, you can see from the 2019 data that the first two weeks in April are prime selling season. This is typically when we see the number of new listings on the market climb. Up until the second week of March when the effects of the pandemic started to impact the real estate market, 2020 was shaping up to provide a much-needed amount of inventory to a market that has been under-served for several years. As of right now, we’re seeing roughly half of the number of new listings year over year; however, we have also seen stabilization in the number of new listings coming to the market over the last 3 weeks.
Under Contract
We see similar trends when looking at the number of homes going under contract. While down 50 to 85% year over year, the last 3 weeks have seen pretty consistent transaction activity. This does indicate a slowing rate of ready, willing and able buyers, but it’s important to note that contract activity has decreased by less than new listing activity. Demand is greater than supply.
Buyer Activity
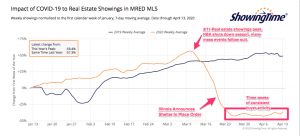
The graph below is a real-time look at showing activity in the Chicagoland area. Of note, you can see that buyer activity was very healthy until March on the day the NBA canceled their season, and many orders on limiting public gatherings quickly followed. We saw a dramatic decline in activity until late March, at which point we started to see the buyer activity level, where it has remained for the past several weeks.
Off-Market Activity
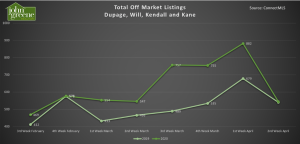
Another trend we have been tracking is off-market activity. This depicts the number of sellers who had their home on the market but decided to take their home off the market. As you can see, even in a strong market like the spring of 2019, there are still a fair amount of sellers that decide to take their homes off the market without a successful transaction.
It’s important to note that even in healthy “Sellers” markets, the “Odds of Selling Rate” typically falls in the 40-60% range. In other words, 1 out of every 2 homes that are listed for sale in a healthy market will result in a successful transaction.
When you juxtapose 2019 vs 2020 you see very similar trends in cancellations vs expired. Expireds are listings that reached the end of their listing agreement between seller and brokerage and chose not to renew. Canceled are the listings that chose to come off of the market, for all other reasons, before the expiration of the listing agreement.
Comparing the two graphs below for 2019 and 2020, you’ll notice the increase of homes coming off the market. Of particular note, the trends from both years are pretty consistent with the exception to the three weeks starting in the third week of March of this year, which correlates to the Shelter-In-Place order in Illinois. The first week in April shows a large spike in expired listings, it’s important to note that many listings have the end of a month as an expiration date (you can see a spike in 2019 as well); yet, it appears a large number of sellers who had reached their listing expiration date at the end of March chose not to renew or extend their listing agreement.
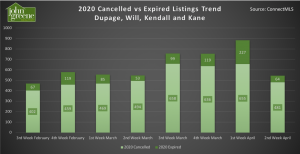
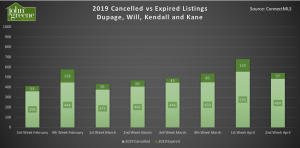
The second week of April is of note as well. You will see the numbers between 2019 and 2020 are almost the same. A week does not a trend make, but when adding in our qualitative data gathered from discussions with all of our sellers, we believe many sellers who were fearful of keeping their listing active during the peak of the pandemic have decided to take their homes off the market. While listing inventory is down, it does appear canceled and expired listing activity has leveled.
What Does it All Mean?
Many buyers and sellers have, understandably, decided to hold off on their plans. Yet, the real estate market remains resilient, with many buyers and sellers needing to move forward. After all, shelter is a necessity. If you are relocating, going through a job transfer, have a lease expiring, or simply need better or bigger space to work from home, the market is active, and the necessary precautions are being put in place to help ensure a successful transaction and protect the health of the community.
If you have real estate-related questions, please don’t hesitate to contact us. We’re here to help!
*All data retrieved from MRED is deemed accurate, but subject to change and cannot be guaranteed.


